


Arbitrum (ARB) and ORDI started the new year on a bullish note, reaching new all-time high prices.
How long will the increase continue for these two altcoins? Keep reading to find out!
ARB Price Reaches New All-Time High
The ARB price has increased alongside a parabolic ascending support trend line since September 2023. The price bounced at the trend line twice (green icons), accelerating its rate of increase both times. More recently, ARB bounced on December 18. It has increased at a rapid rate since.
Today, ARB reached a new all-time high of $1.84, surpassing the previous all-time high of $1.82. Cryptocurrency trader JJCycles believes this will lead to more acceleration once ARB reaches price discovery. However, this has not happened yet, as ARB has not yet closed above the $1.75 region.
Nevertheless, the 3-day Relative Strength Index (RSI) supports the increase. Traders utilize the RSI as a momentum indicator to assess whether a market is overbought or oversold and whether to accumulate or sell an asset. If the RSI reading is above 50 and the trend is upward, bulls still have an advantage, but if the reading is below 50, the opposite is true.
If the upward movement continues, ARB can increase by 40% and reach the next resistance at $2.50. The resistance is created by the 1.61 external Fib retracement of the previous drop.
Despite the bullish ARB price prediction, a close below the $1.75 resistance will invalidate the breakout. This could also cause a breakdown below the parabolic ascending support trend line. Then, the ARB price can fall by 30% to the next closest support at $1.20.
Read More: What is Arbitrum (ARB)?
Can ORDI Move to $100?
ORDI was one of the biggest gainers in November and December. Since November 7, the price has increased by a massive 1,400%, leading to a new all-time high of $92 today.
The entire movement has been contained inside an ascending parallel channel. However, ORDI is moving above this channel’s resistance trend line, coinciding with the $87 Fib retracement resistance.
The 12-hour RSI supports the legitimacy of the breakout. The indicator increases and breaks out from its bearish divergence trend line (green).
Cryptocurrency trader NobleCoins believes the rally will not stop once the price reaches $100. If the upward movement continues, the price can increase by another 30% and reach the next resistance at $116.
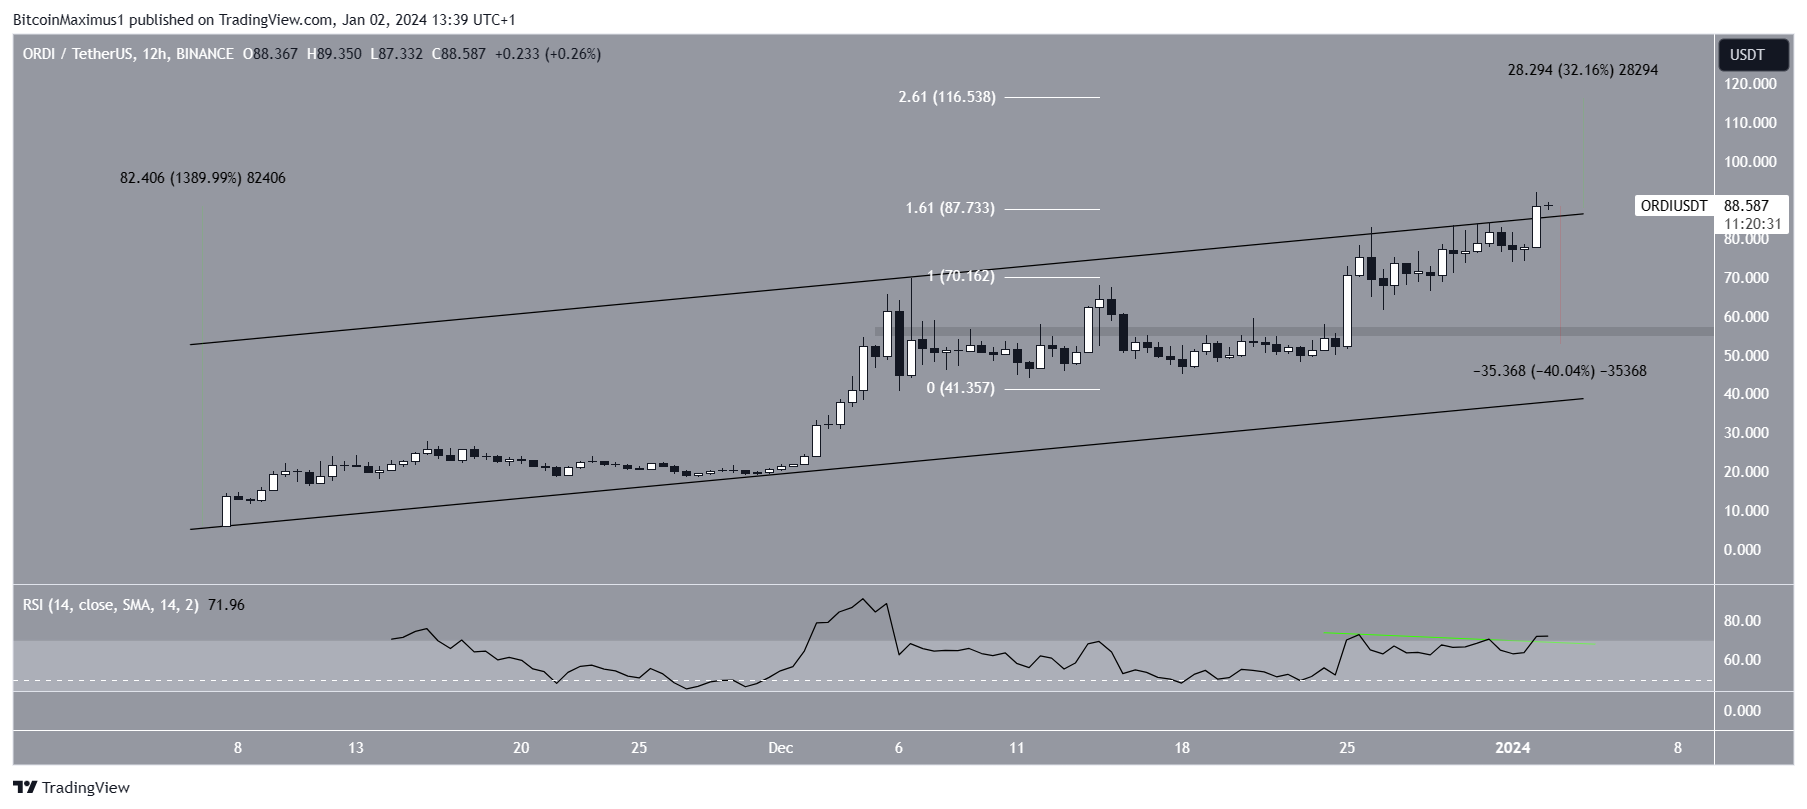
Despite the bullish ORDI price prediction, failure to break out from the channel can mean the local top is in. Then, ORDI can fall by 35% to the closest support area of $56.
Read More: Everything You Need to Know About Ordinals
For BeInCrypto’s latest crypto market analysis, click here.
Disclaimer
In line with the Trust Project guidelines, this price analysis article is for informational purposes only and should not be considered financial or investment advice. BeInCrypto is committed to accurate, unbiased reporting, but market conditions are subject to change without notice. Always conduct your own research and consult with a professional before making any financial decisions. Please note that our Terms and Conditions, Privacy Policy, and Disclaimers have been updated.
Be the first to comment