The price of the leading meme coin, Dogecoin (DOGE), has recently witnessed a meteoric rise. Rallying by 111% over the past week, the coin currently trades at a three-year high of $0.40.
However, technical indicators suggest that the rally may be losing momentum, and a potential pullback could be on the horizon.
Dogecoin Is Overbought
Dogecoin’s price has climbed 7% in the past 24 hours. However, during the same period, its trading volume declined by 33%, confirming the gradual surge in the meme coin’s selloffs.
When an asset’s price climbs but trading volume drops, it signals a weakening in the rally’s momentum. Lower trading volume during a price increase indicates that fewer investors are actively buying at these higher levels, suggesting reduced demand. This divergence is a bearish sign, as it means that the price increase lacks the strong buying support needed for a sustained rally.
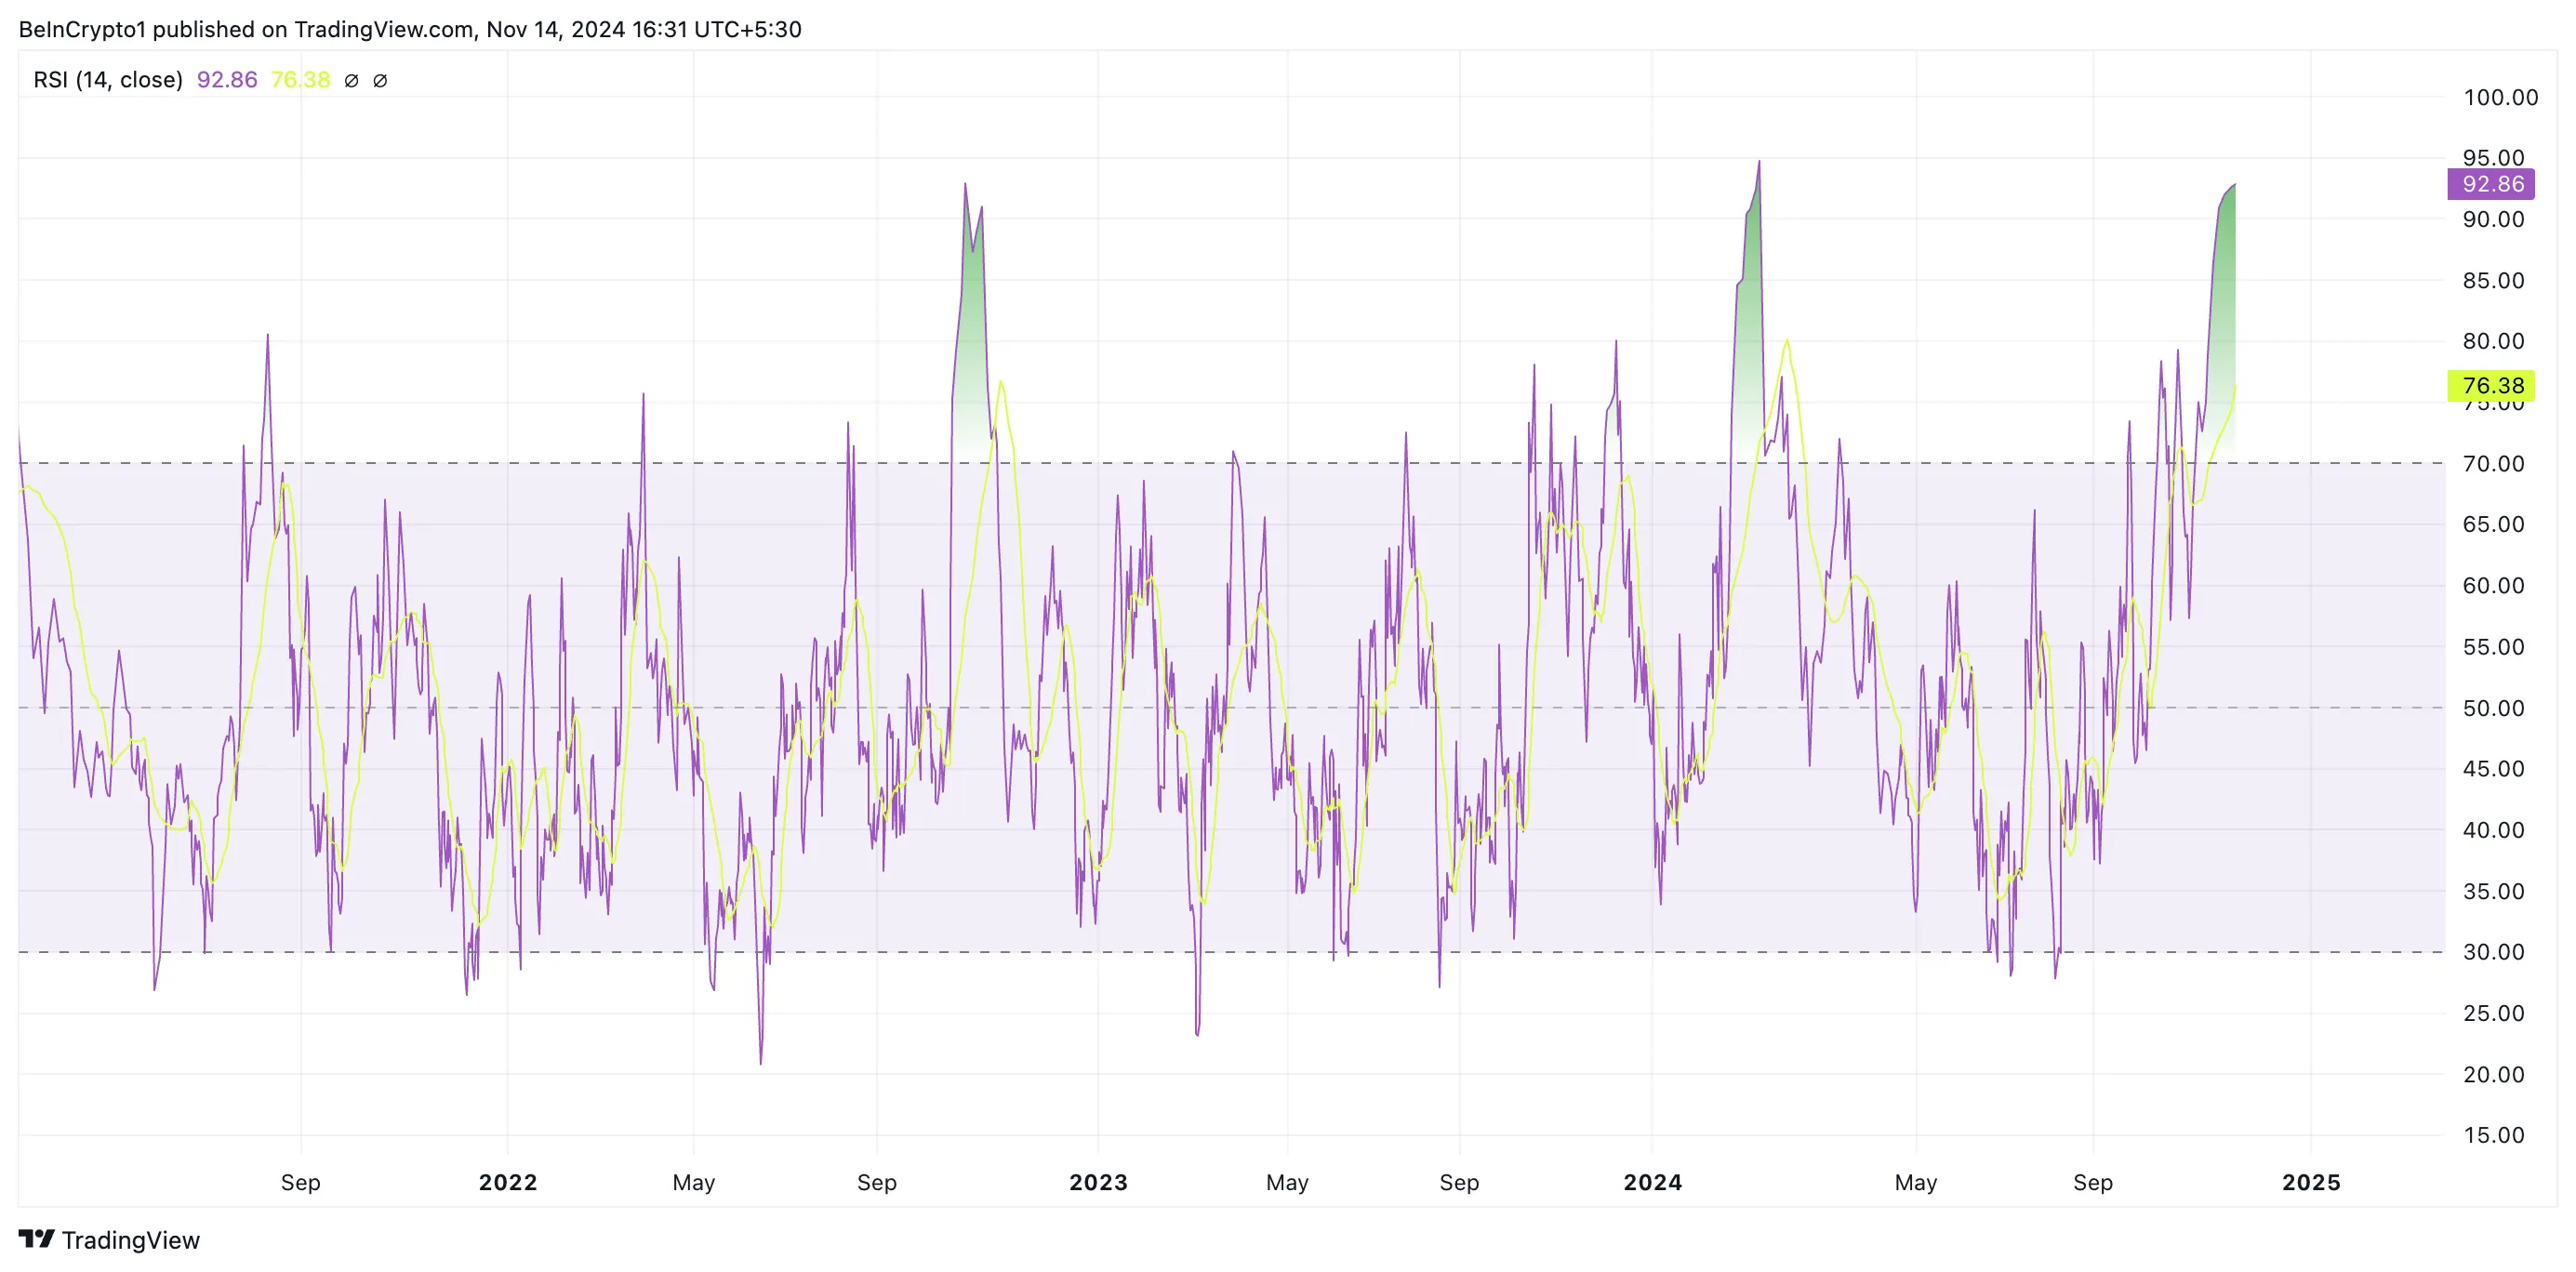
Moreover, readings from the DOGE/USD one-day chart show that the altcoin has been overbought and is due for a pullback. The coin’s Relative Strength Index (RSI) is the first indication of this. As of this writing, the indicator’s value is 92.86, its highest since March.
The RSI measures an asset’s overbought and oversold market conditions, and it ranges between 0 and 100. Values above 70 indicate that the asset is overbought and due for a correction. Conversely, values under 30 suggest that the asset is oversold and may witness a rebound.

DOGE’s RSI reading of 92.86 indicates that it is significantly overbought and that a price correction is inevitable in the near term.
DOGE Price Prediction: Fall Under $0.30 Imminent
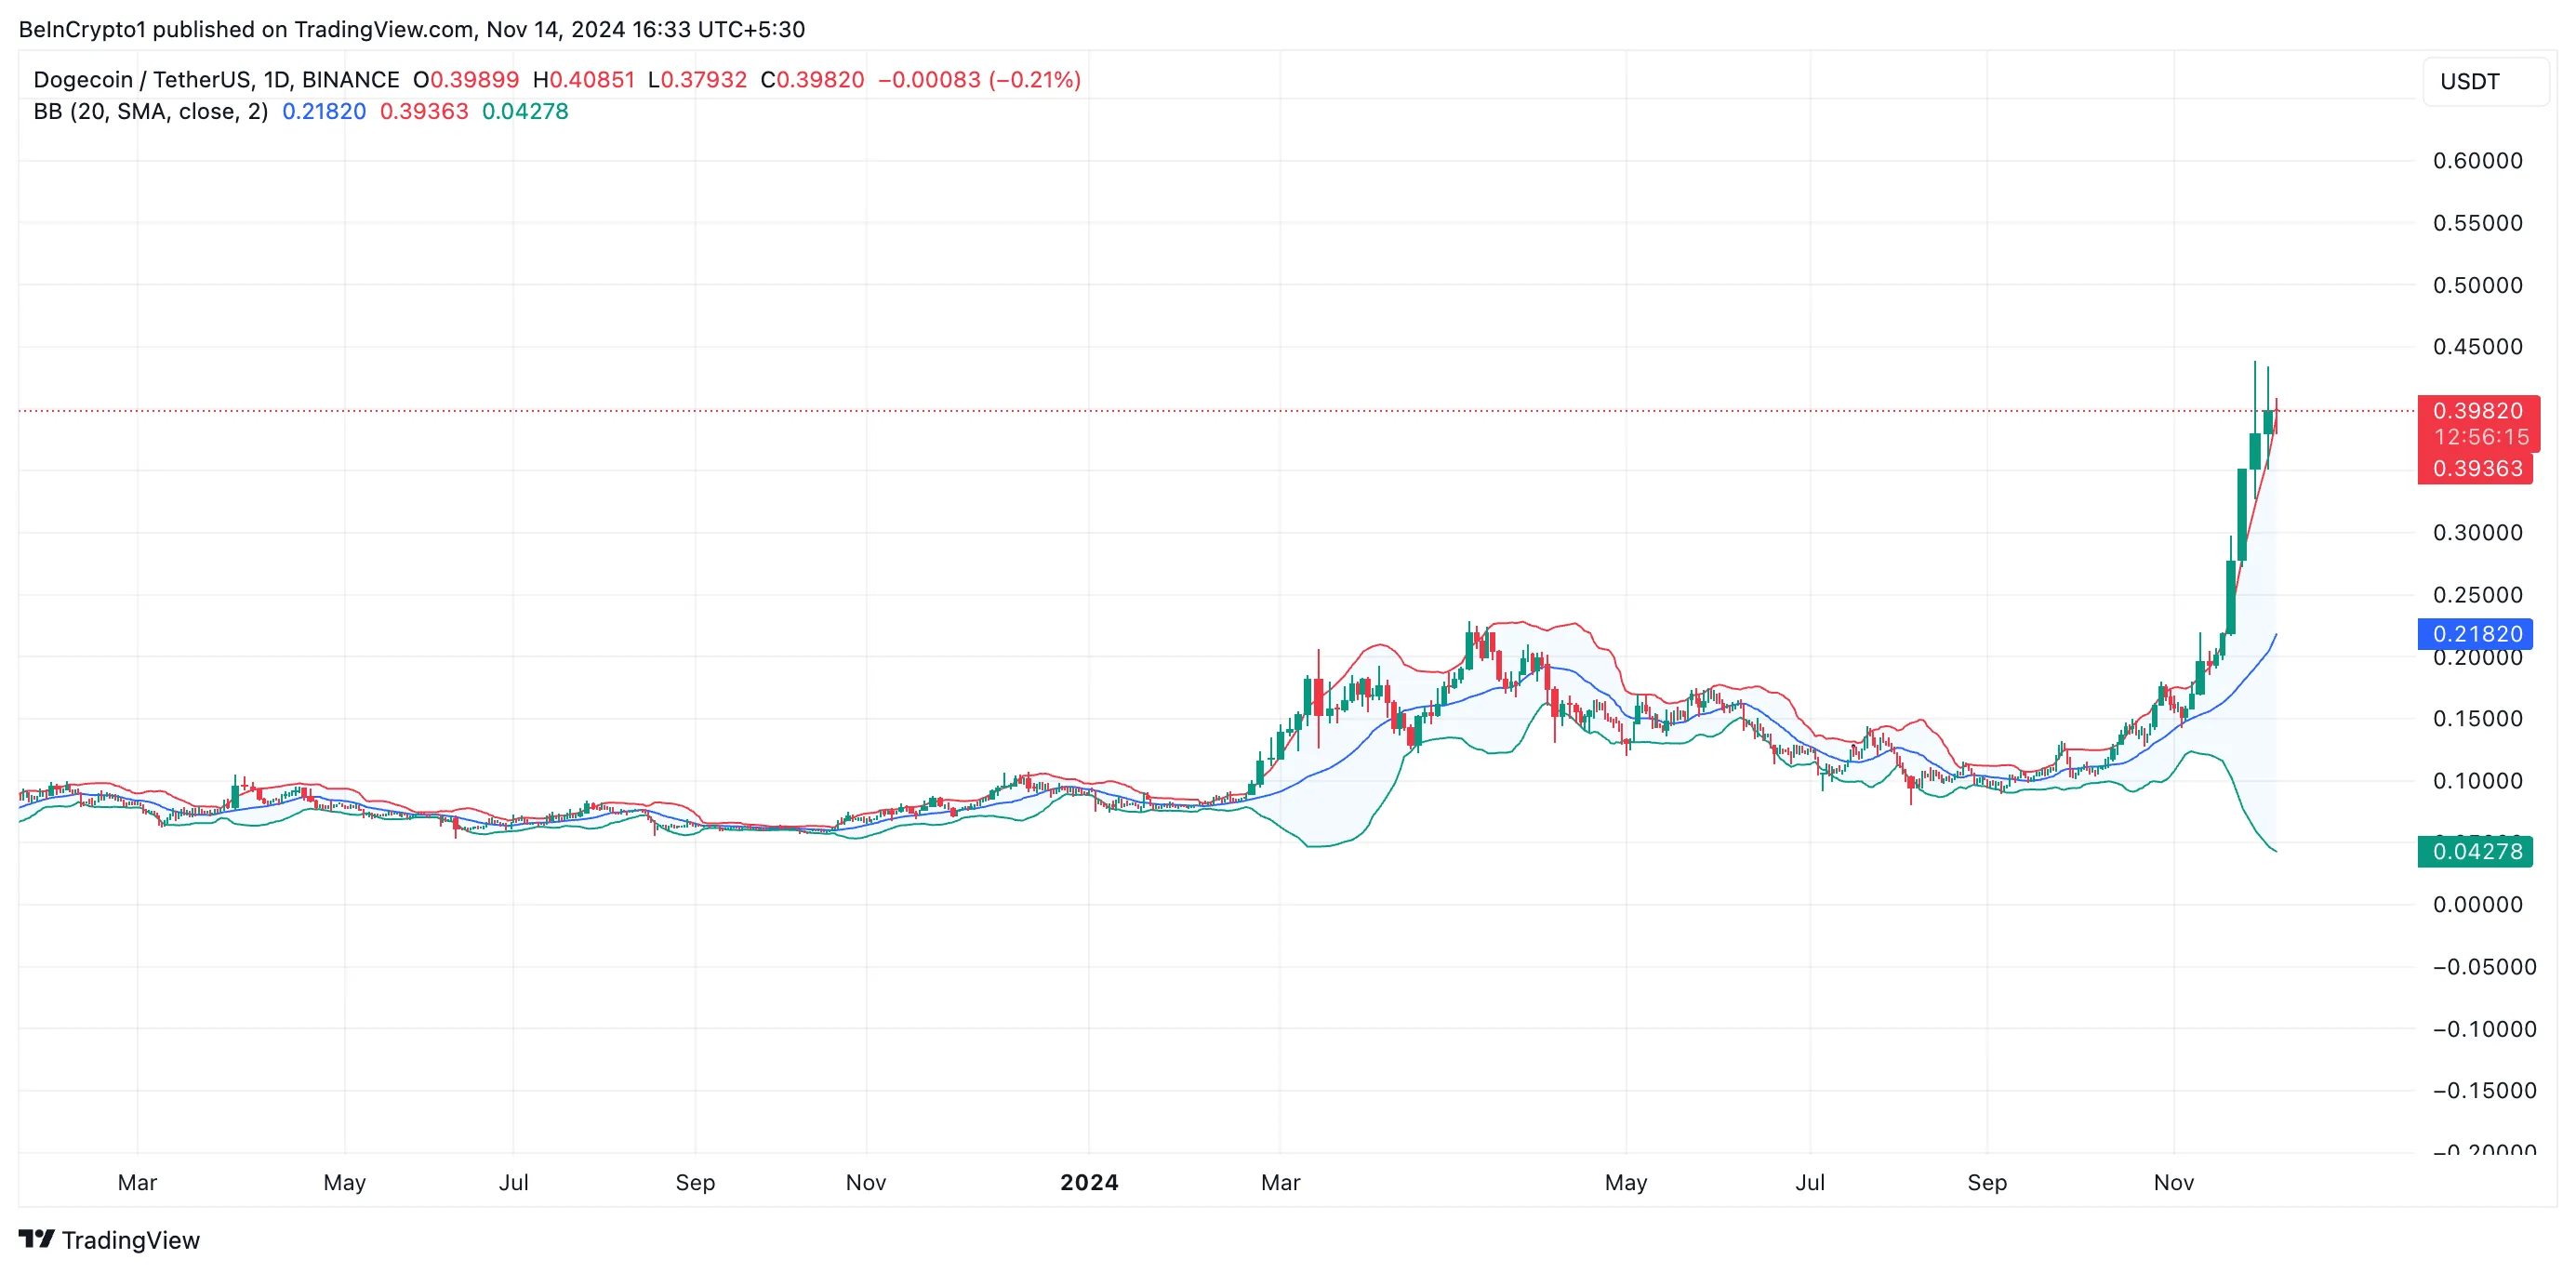
DOGE’s price is currently placed above the upper band of its Bollinger Bands indicator, confirming the possibility of a price retracement in the short term.

The Bollinger Bands indicator measures market volatility and identifies possible buy and sell signals. It comprises three primary components: the middle band, upper band, and lower band.
When an asset’s price rises above the upper band, it suggests that the asset may be overbought and overextended. Traders interpret this as a signal of potential downward pressure and take it as an opportunity to sell and lock in profits.
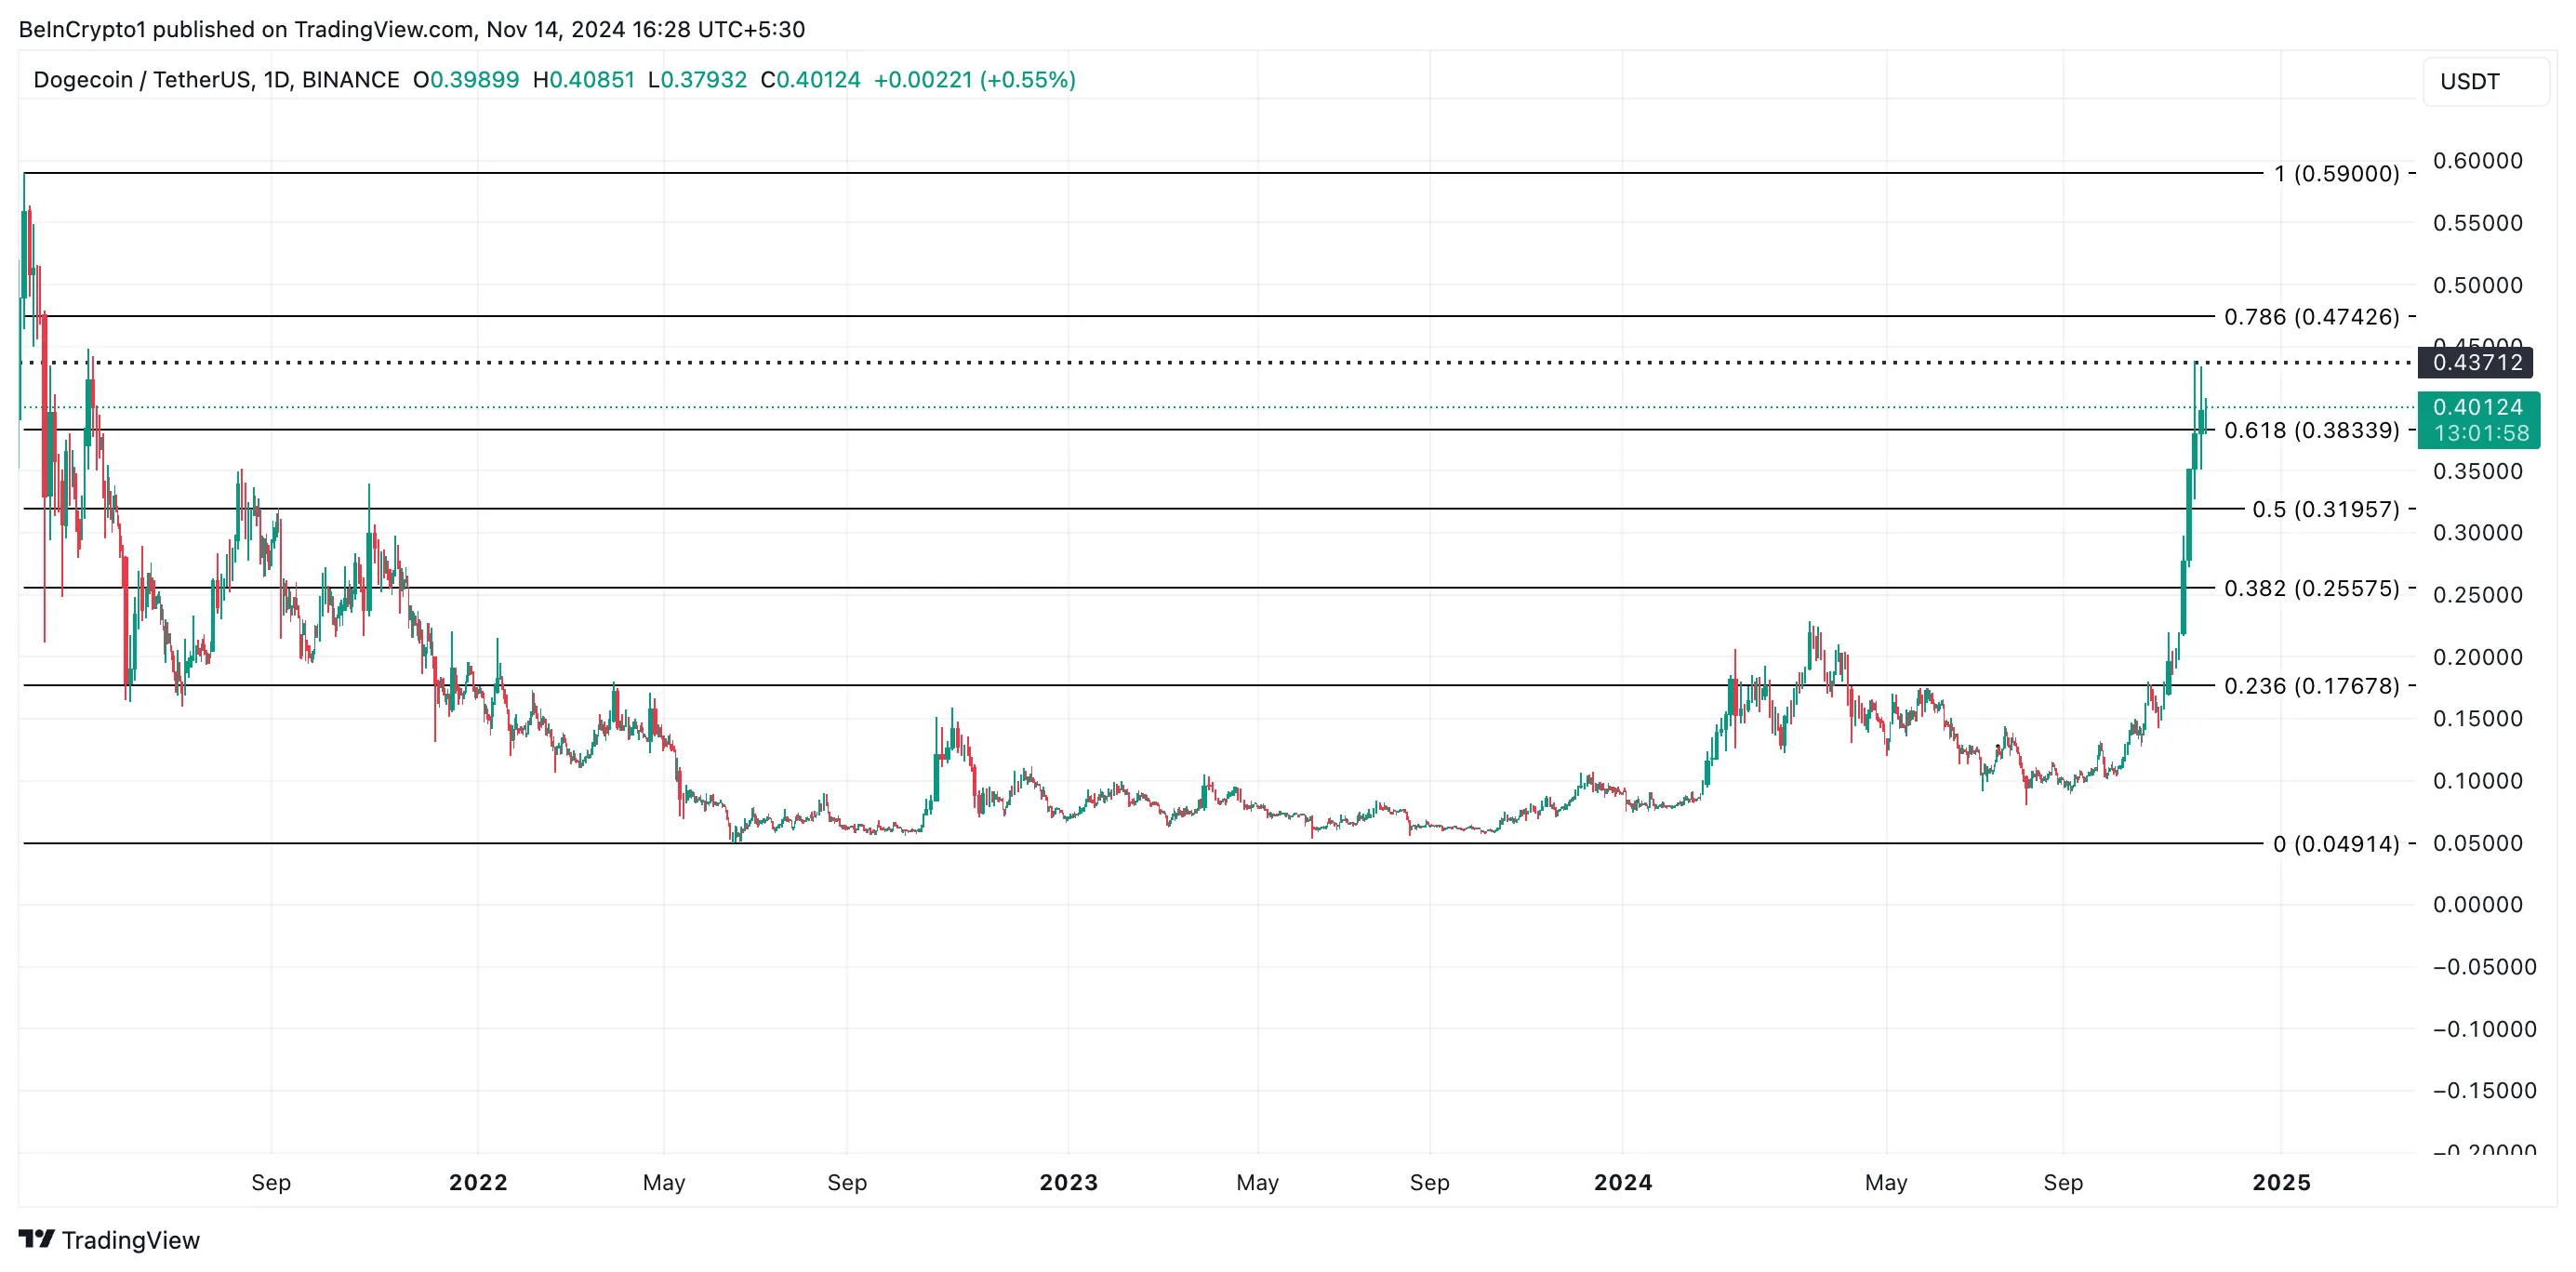
DOGE is currently trading at $0.40. Once a price correction begins, DOGE will likely test support at the $0.38 level. However, if buying pressure is weak and bulls cannot hold this line, the coin could drop sharply to $0.31.
Further selloffs at this point may drive the price even lower to $0.25.

If demand strengthens, the Dogecoin price rally could reach $0.43, its peak so far during this bullish cycle, and potentially push toward $0.47—a level last seen in May 2021.
Disclaimer
In line with the Trust Project guidelines, this price analysis article is for informational purposes only and should not be considered financial or investment advice. BeInCrypto is committed to accurate, unbiased reporting, but market conditions are subject to change without notice. Always conduct your own research and consult with a professional before making any financial decisions. Please note that our Terms and Conditions, Privacy Policy, and Disclaimers have been updated.


Be the first to comment