


The Ripple XRP price has traded without significant volatility since August, having consolidated in a narrow range.
The price action since November has been even more neutral. Will XRP regain volatility soon, or will next year bring more of the same?
Ripple Consolidates Above Horizontal Support
The weekly time frame technical analysis shows that XRP has increased alongside an ascending support trend line since May 2022.
The line has been validated numerous times, more recently in March 2023 (green icon). Since then, XRP has increased alongside a steeper ascending support trend line.

While the XRP price reached a new yearly high in July (red icon), it has not come close to reaching it since. Rather, it created a lower high in November (red icon) and then fall. The price now trades above an important horizontal support area.
The Relative Strength Index (RSI) is a momentum indicator traders use to evaluate whether a market is overbought or oversold and whether to accumulate or sell an asset.
Readings above 50 and an upward trend suggest that bulls still have an advantage, while readings below 50 indicate the opposite.
The RSI is increasing and above 50. While these are signs of a bullish trend, it is worth mentioning that the upward trend is quite gradual.
Read more: How to Buy XRP and Everything You Need to Know
XRP Price Prediction: Volatility Incoming?
The technical analysis of the daily time frame does not provide a clear direction for the future trend. This is because of both the price action and the RSI.
The price action shows a symmetrical triangle in place since July. The symmetrical triangle is considered a neutral pattern, meaning that a breakout and breakdown from it are possible.
Read More: Getting Started With XRP Wallets
Cryptocurrency trader Dom believes the price will break out from this pattern. He tweeted:
“I really can’t imagine a scenario where this breaks down… I really can only imagine an explosive breakout. XRP is not a security, and managed to stay in the top 8 cryptos for 9 years, without even making a new high last run!“
However, the RSI is at 50, indicating an undetermined trend. It is also worth mentioning that XRP whales recently accumulated 360 million XRP tokens.
So, whether the XRP price breaks out from the triangle or breaks down from the $0.58 horizontal area instead will determine the future XRP price prediction.
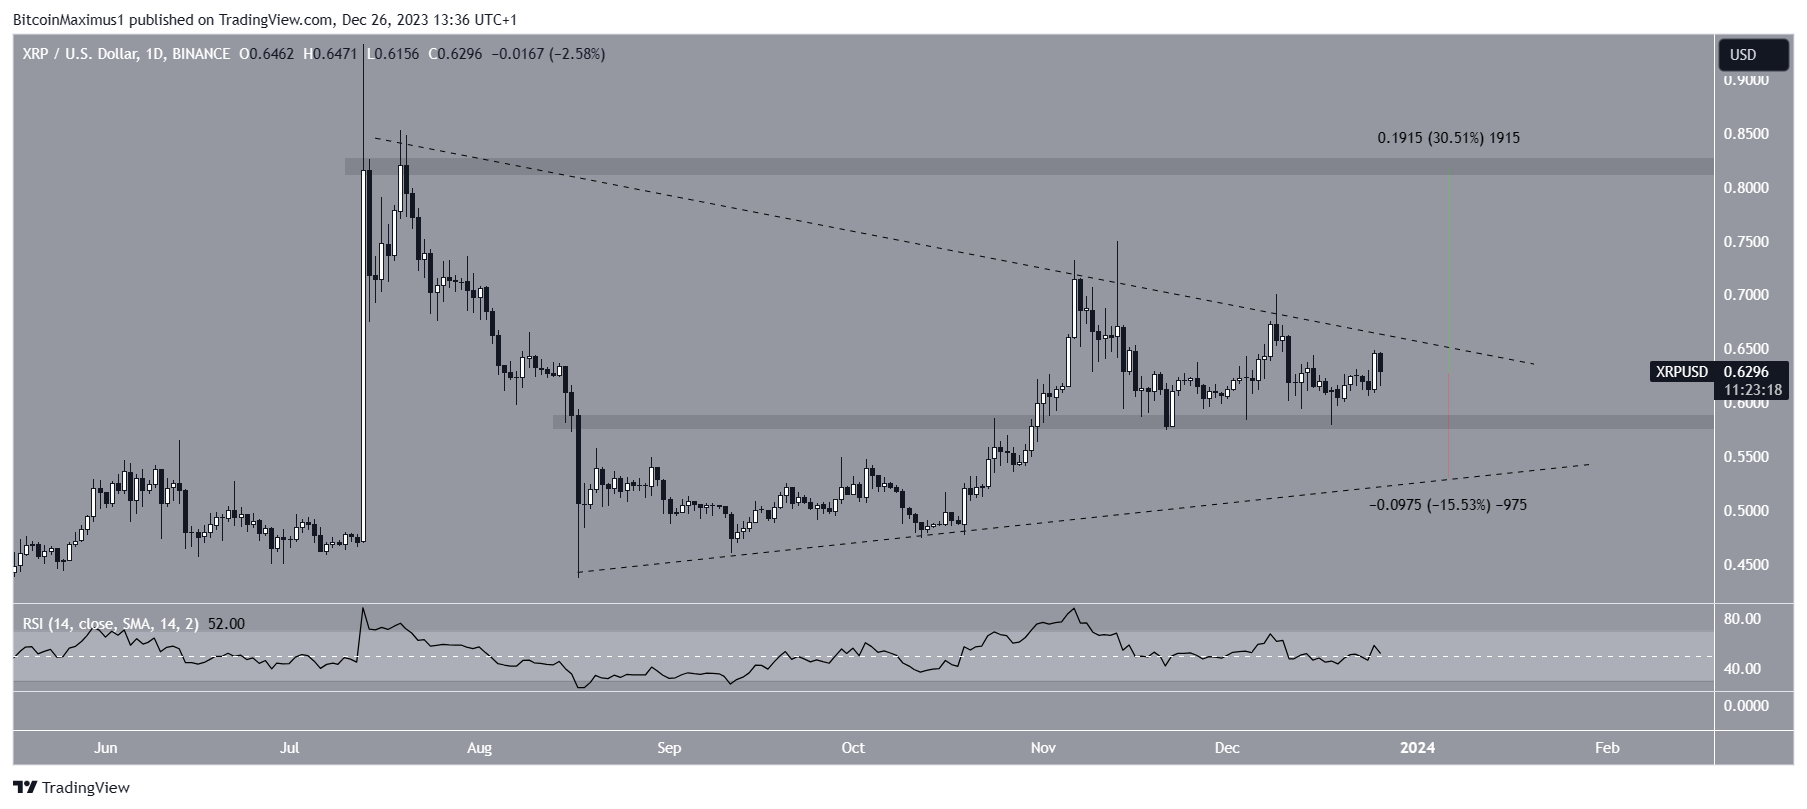
A breakout from the triangle can trigger a 30% increase to the next resistance at $0.82. On the other hand, a breakdown from the $0.58 horizontal area can take the XRP price back to the ascending support trend line at $0.55.
For BeInCrypto’s latest crypto market analysis, click here.
Disclaimer
In line with the Trust Project guidelines, this price analysis article is for informational purposes only and should not be considered financial or investment advice. BeInCrypto is committed to accurate, unbiased reporting, but market conditions are subject to change without notice. Always conduct your own research and consult with a professional before making any financial decisions. Please note that our Terms and Conditions, Privacy Policy, and Disclaimers have been updated.

Be the first to comment